
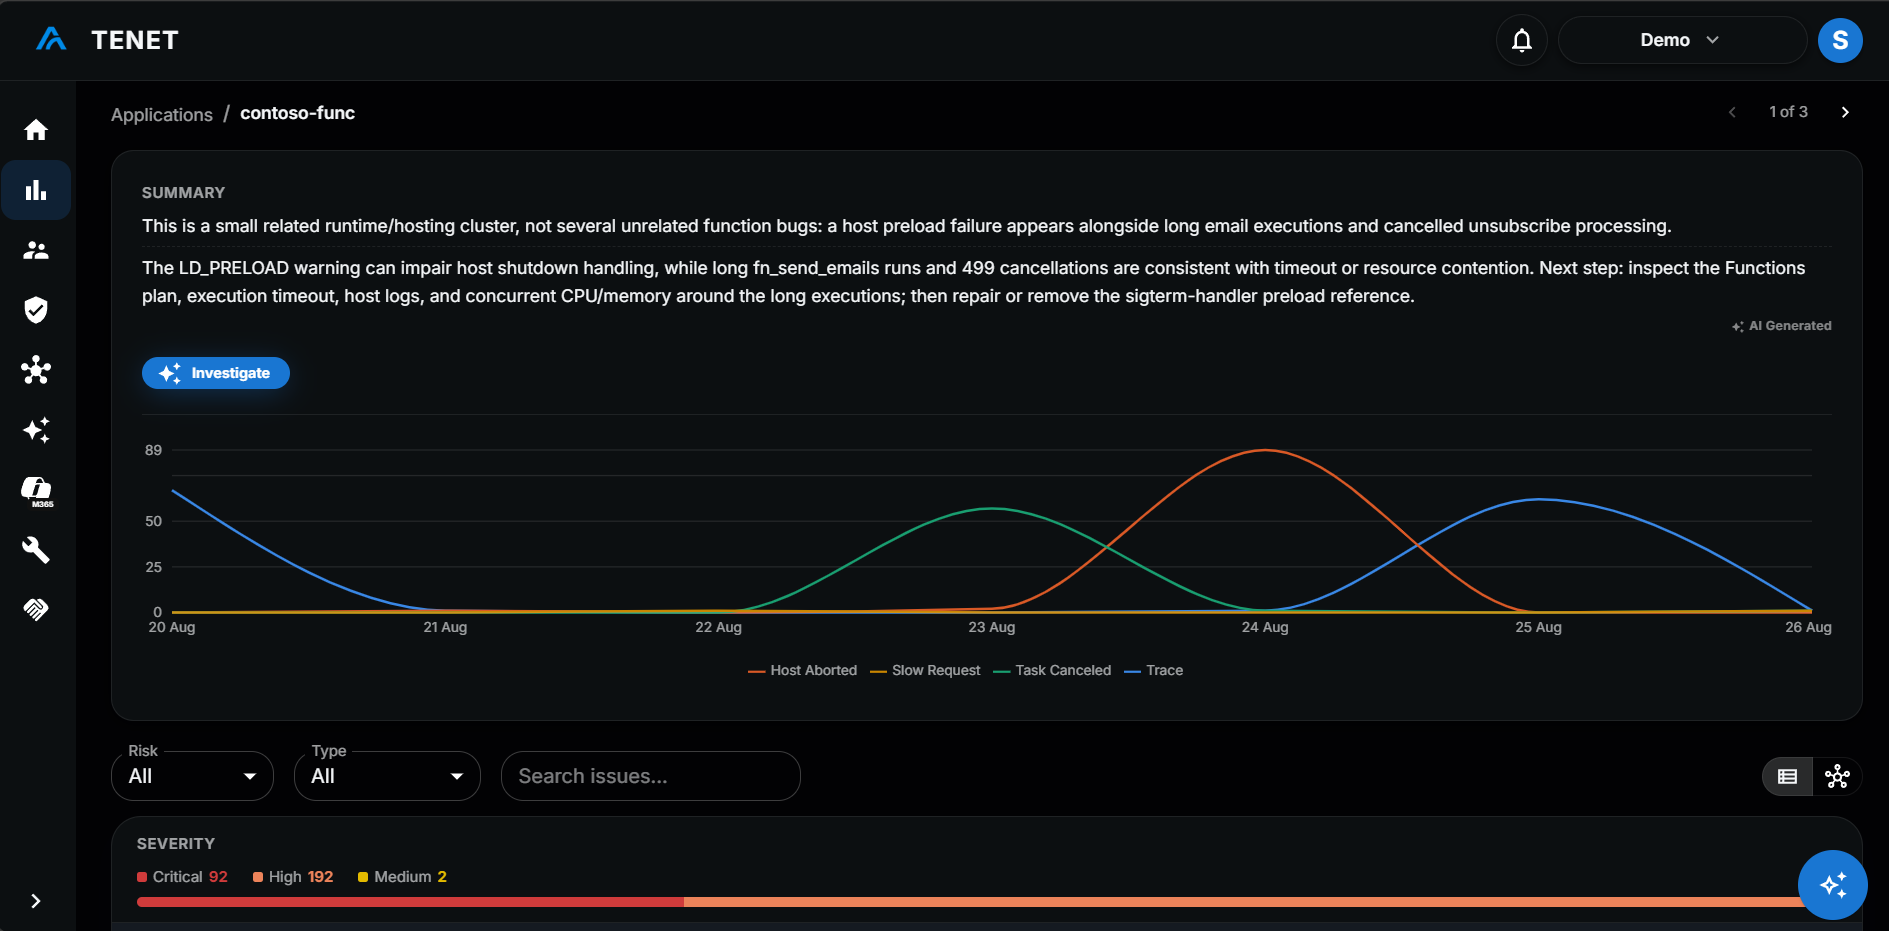
Surface application failures with full context
Each application gets one row with its health status, worst severity and issue count, so failing apps stand out. Open it for an AI summary and the full issue list. Use Investigate with Brite to find one root cause or several.
Dependency Map
See every service an application called over the last 7 days, drawn as a map. Each service is marked as in your tenant or as leaving it, so outside vendors are never hidden.
Alerts where your team works
Receive actionable anomaly alerts directly in Microsoft Teams, so your team can triage and respond without leaving the tools they already use.
Powered by Azure-native telemetry
FAQs
How is this different from Azure Monitor alerts?
Does it work across multiple subscriptions and tenants?
Yes. TENET analyses resources in all the subscriptions in any tenant it's given access to and processes the data in parallel. Multi-tenant support means each tenant's data is completely isolated.
Managing many tenants? See TENET for MSPs and MSSPs.
What are the benefits of using TENET for Azure monitoring?
TENET gives teams running workloads on Azure four advantages:
- Earlier warning. By monitoring application and infrastructure signals against intelligent baselines, TENET helps surface issues before end users report them.
- Broader detection. TENET detects anomalies across compute, storage, networking, databases, and identities, so problems are caught in one place rather than reacting to outages.
- Less tool switching. One view of workload, application, cost and identity signals means less time spent correlating them across separate tools.
- A shared picture. With one view of how your Azure environment is behaving, engineering and operations teams can make decisions from the same data.
Does TENET require installing agents on my virtual machines?
No agents required. TENET connects directly to the Azure Resource Manager and Azure Monitor APIs, so there is nothing to install on your virtual machines, containers, databases, function apps, or storage accounts.
See the Microsoft cloud integration guide for the exact roles and setup steps.
Explore more resources
Move to proactive monitoring
Anomaly detection across every connected subscription from day one.