
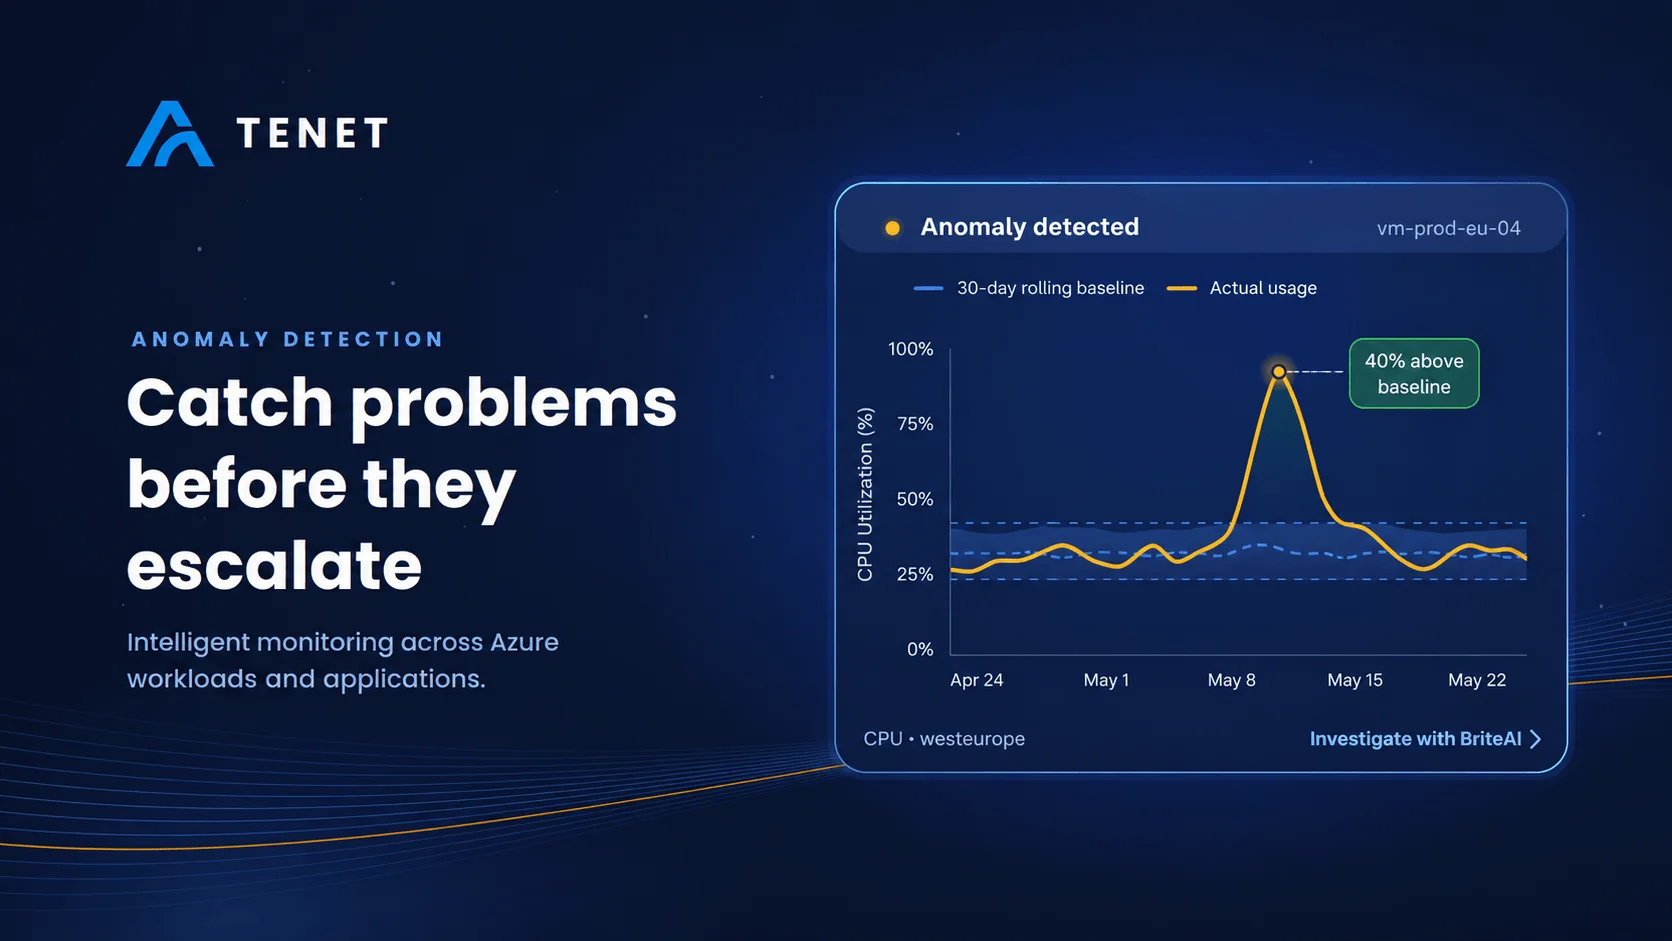
Most Azure environments are not monitored, they are alerted on. Teams configure static CPU thresholds, set memory warnings, and wire up a handful of Azure Monitor rules. When something crosses a line, a notification fires. When it does not, the assumption is that everything is fine.
That assumption breaks regularly. A resource can behave abnormally without ever crossing a static threshold. A compromised identity can operate quietly for hours. Static rules catch the obvious failures. Anomaly detection catches everything else.
Why static thresholds are not enough
The problem with fixed thresholds is that they require you to know in advance what "wrong" looks like. A CPU at 80% is normal for a batch processing cluster and alarming for an idle API server. A sign-in from a new country might be expected for a traveling executive and critical for an administrative account that never leaves the region.
Applying the same rule to both scenarios produces either too much noise or too many misses. Teams quickly learn to tune thresholds aggressively to silence the noise, which means they are also silencing the early warnings.
How intelligent baselines change the signal
TENET establishes a rolling baseline for each resource based on its actual historical behavior, season, time of day, scheduled actions and more. Baselines are relative, not absolute and continue to evolve as TENET learns more about the resource behavior and usage patterns.
The result is less noise, ensuring you only receive alerts that actually require your attention.
What TENET monitors
- Workload and performance anomalies. TENET tracks compute, storage, networking, databases, function apps, and containers. Metrics, logs, traces, events, and behavioral signals are ingested together. When P99 latency spikes on a VM, when error rates climb on a production API, or when storage egress deviates sharply from normal, the deviation surfaces as a prioritized anomaly rather than a raw metric alert.
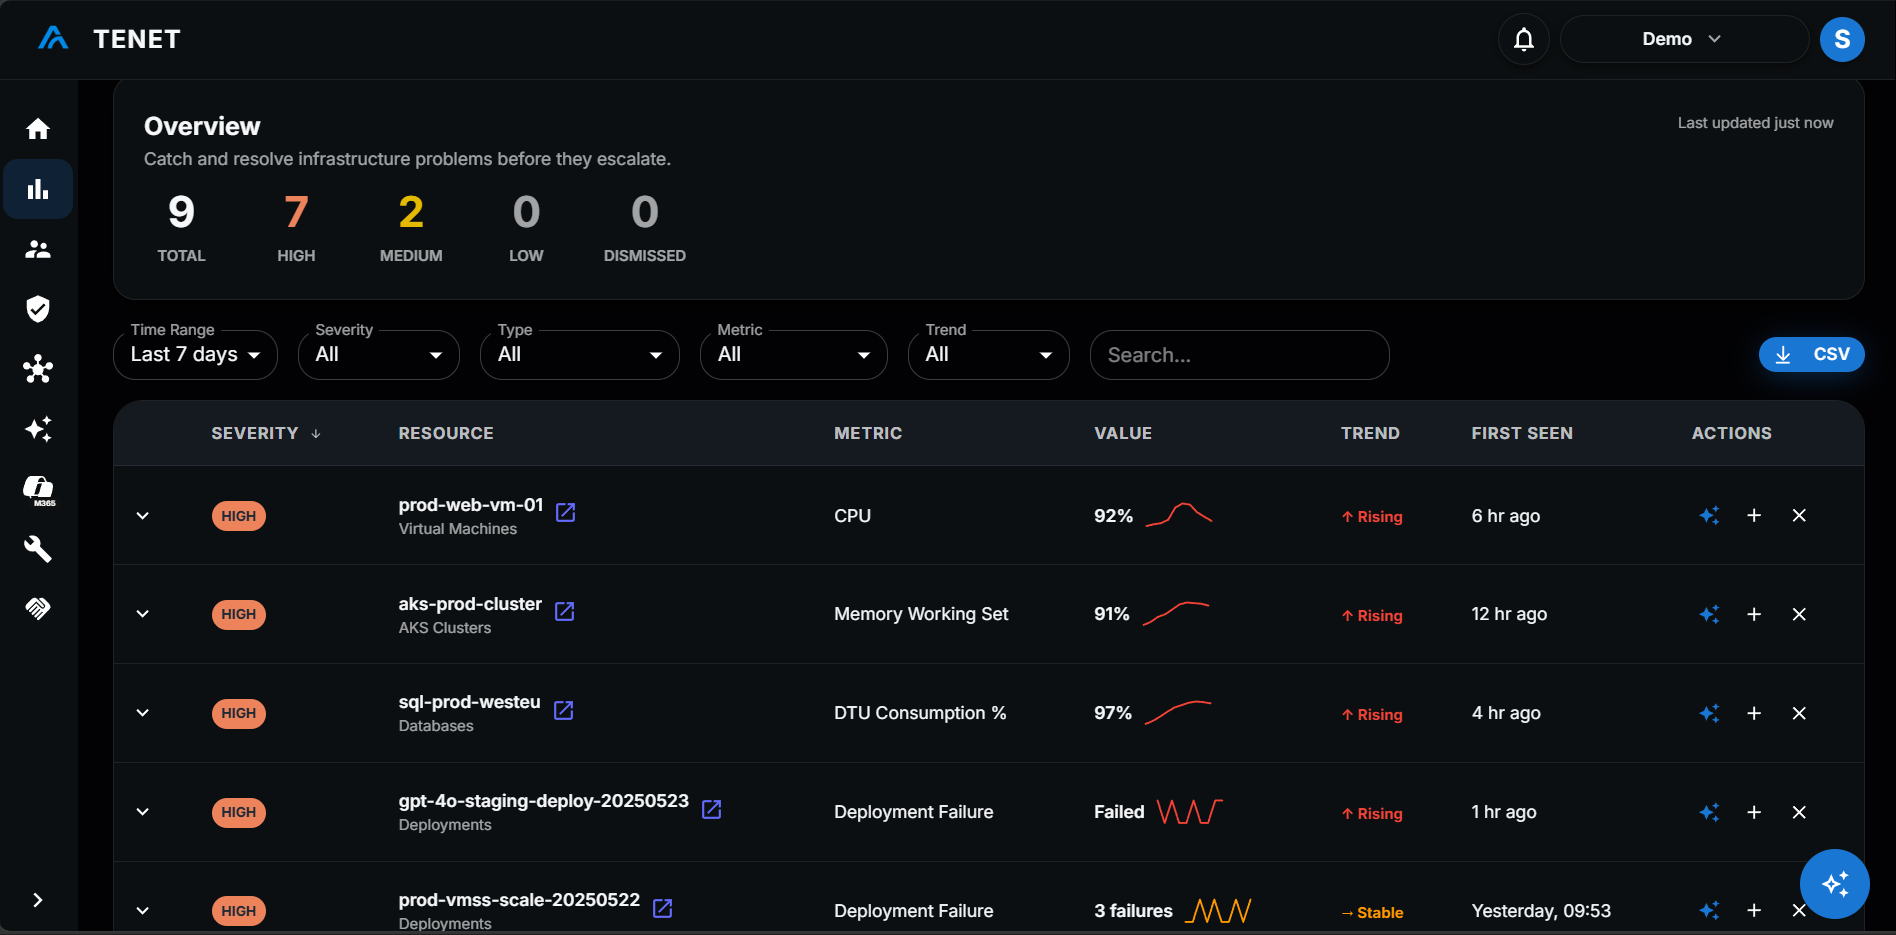
- Application anomalies. Application failures often originate several layers below the surface. TENET correlates distributed traces from Application Insights to identify the span where failures originate. For example when a checkout flow times out, the trace view shows that the root cause is a payment gateway timeout four hops deep, not the API surface where the error appears.
Investigation in plain language
BriteAI provides a natural language summary for anomalies but also helps you identify root cause and implement remediation. Rather than navigating to separate dashboards or writing queries, teams can ask directly: what caused this, what is the blast radius, what should we do next. Answers draw on your live Azure data and TENET's correlation engine.
For log-heavy investigations, BriteAI accepts natural language queries against Log Analytics workspaces. What would normally take multiple Kusto queries becomes a conversational exchange.
Alerts in Microsoft Teams
Anomalies are delivered to Microsoft Teams channels with full context and trend ensuring that the person receiving the alert has enough information to understand the issue and how urgent it is with trend markers.
Getting started
TENET requires no agent installation, instrumentation, or threshold configurations and covers every subscription in scope from the first data refresh.
Want to see TENET in action? Start a 14-day free trial or request an assessment.